

Tons of information comes to us from all around each day. Sometimes it’s really difficult to grasp it in its primary form. But designers have the talent to turn all this boring data into awesome presentations using graphs and charts.
Charts, graphs and counters don’t take too much space, but have amazing ability to show off a huge amount of information in a briefly form. And all mobile users appreciate it a lot, as small mobile screens require their own rules. Today I’d like to show you 20 mobile app graphs and charts designs to present different data. Statistics from banks, insurance companies, other financial institutions, and even weather forecasts are available on smartphone devices in graphs and charts. So, scroll down and enjoy the designs!
Stats iPhone UI by Unity


GLEIS7 ENTERTRAINMENT APP by Claudia Eggimann

App Analytics by Sergey Zolotnikov

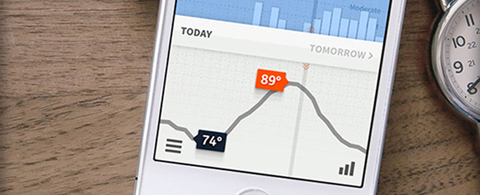
Weathertron by Ryan Lucas

My IT Expert IOS Flat app design by UI Kreative

Weather app by Anu Raveendran


Stats iOS 7 style by David Cristian

GLEIS7 ENTERTRAINMENT APP by Claudia Eggimann

Step Counter app by Marusa Novak

Management App – Mauve by Ismail MESBAH

Pillow: Smart Sleep Cycle Alarm Clock by Neybox Interactive

Android App Concept Calendar View by Alek Manov

Electric bike dashboard by Romina Kavcic

BISPECK – UI/UX DESIGN by Scott Henderson

Graph screen (WIP) by Zeki

EM by Seven


W2B Drive App, Statistics page by Oleg Toptalov (4EPIKart)

Expenses manager app by DSEEER Kate

Smart stats by Romina Kavcic

RIGID STATS : A statistics App by Jagadish Thanki

Focus Statistics by Iris

Dashboard UI by Vitaly Rubtso

Iphone Data App by Octav Design

Plano UI Kit v.1 – Flat UI Kit by Edwin “Eddie” Diaz

Nameless app by Nicolas Bussière
