
People who know about Chrome’s Developer Tools should already know how amazing they can be. Web Inspector is the Safari/WebKit alternative with many of the same features.
Just recently the WebKit team put up a new blog post about measuring bottlenecks in performance. The Web Inspector allows developers to study laggy load times, problematic resources, and other issues within the website’s rendering. Now there’s a brand new tool used for locating and resolving performance issues.
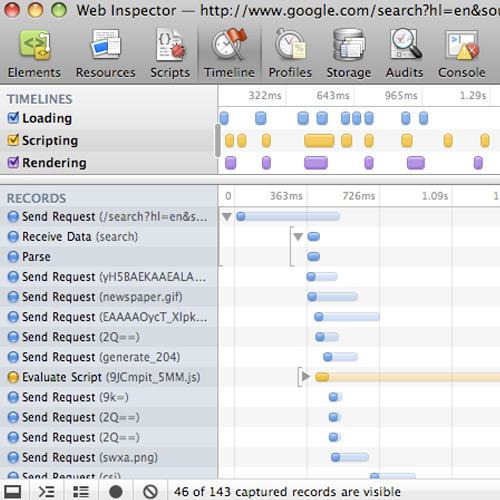
The Timelines Tab is part of Inspector which shows a tabular list of resources downloaded by the page. You’ll also see a chart that records total download time for each resource.

But a new Rendering Frames mode shows a task-specific breakdown of each resource. This allows developers to study performance down to thousandths of a millisecond to pinpoint issues with rendering pages, either multiple resources or just a single pesky problem-maker.
The rendering frames info can be broken down into three panels: overview graph, records table, and the summary chart. Data is consistent but the information is unique and displayed in ways to zoom in on a single resource.
Not everyone uses Web Inspector or knows how to use it properly. But this is undoubtedly a fantastic addition to the WebKit open source project.
If you’d like to learn more take a peek at WebKit’s blog post. It includes a detailed overview of how the new panel works, how to skim data, and how you might use this data to locate rendering problems with high-performance websites.


Leave a Reply